Quick Start
User Guide
Genome viewer
BioMercator integrates structural and functional annotation; a genome version corresponds to a structural annotation, a functional annotation and anchors between the genetic map and the sequence.
Loading a new genome version
You’ll need to download 2 files corresponding to the annotation (too heavy to be included in the BioMercator package). You’ll find them in the “tutorial/Physic Files” folder. * The structural annotation in maize sequence ZmB73_5b_FGS.gff.gz * The functional annotation ZmB73_5a_xref.txt.gz Extract each file into the ‘tutorial/Physic Files’ folder.
Click in the menu: ‘File/New genome version’; Choose a name for the genome version (‘maize_1’) Click on browse for the structural annotation, and choose the ‘ZmB73_5b_FGS.gff’ file
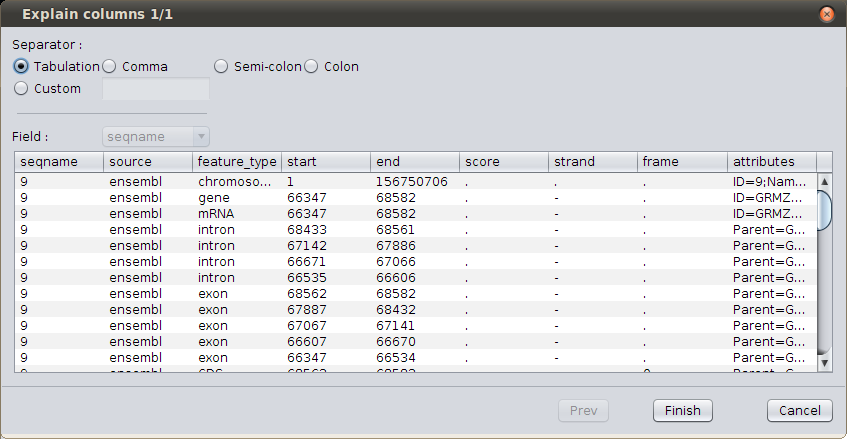
Browse GFF file
The wizard show you the first lines in the file; it is set by default to use a GFF3 file, so you don’t need to change anything; just click on Finish.
Now, click on browse for the functional annotation, and choose the ‘xref.txt’ file. As before, just click finish as the columns are in the right order. Click on browse for the anchors and choose the ‘anchors.csv’ file.
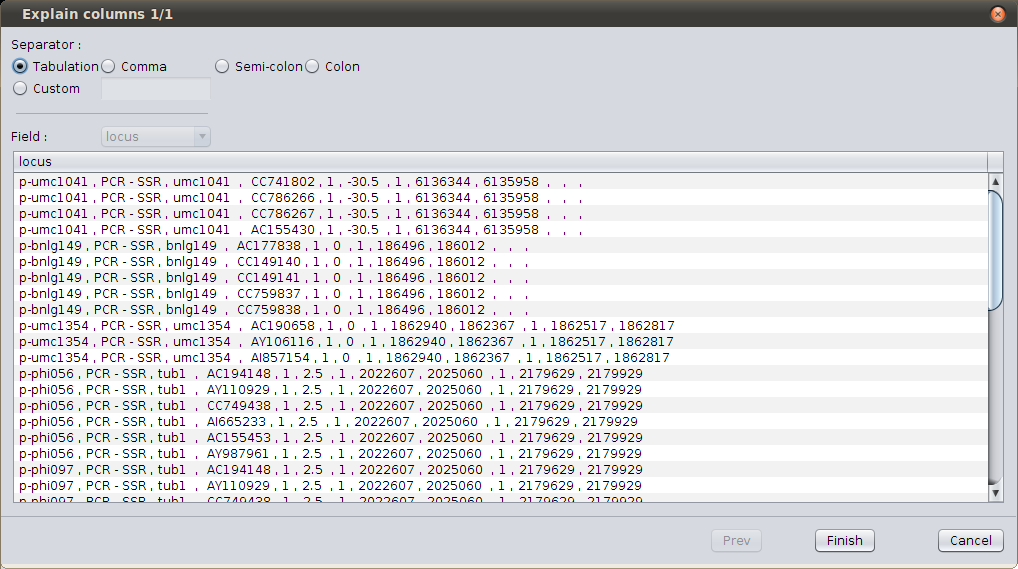
Browse anchor file
As you can see, the wizard fails to display correctly the file; here, the file separator should be “space-comma-space”; select the ‘Custom’ separator and type “ , “ (in words : “space” “comma” “space”). The display should now be better.
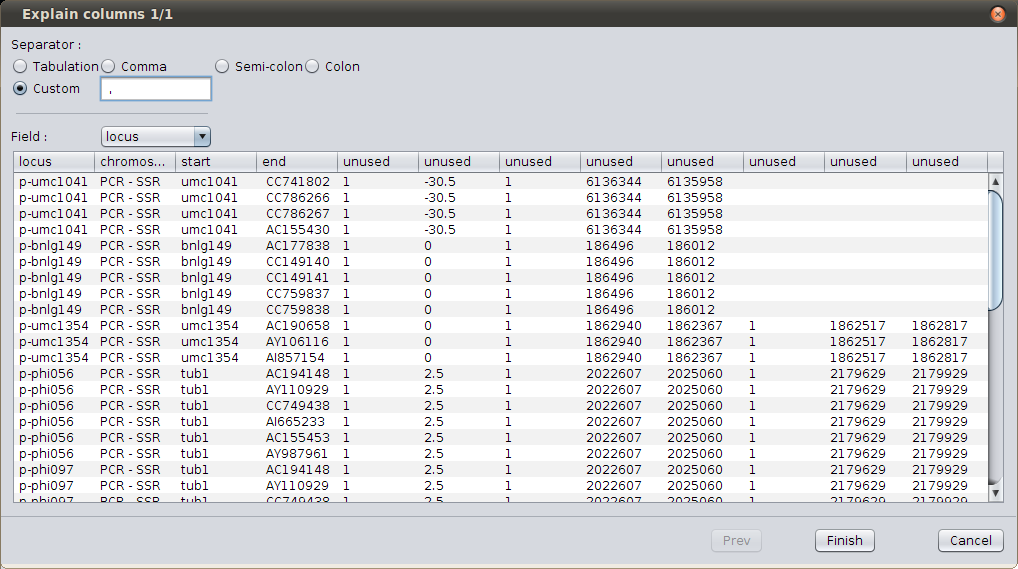
Define custom separator
As you can see, the columns titles don’t corresponds to the files columns. Click on the column and use the combo box to change their title until they are similar to the following screenshot.
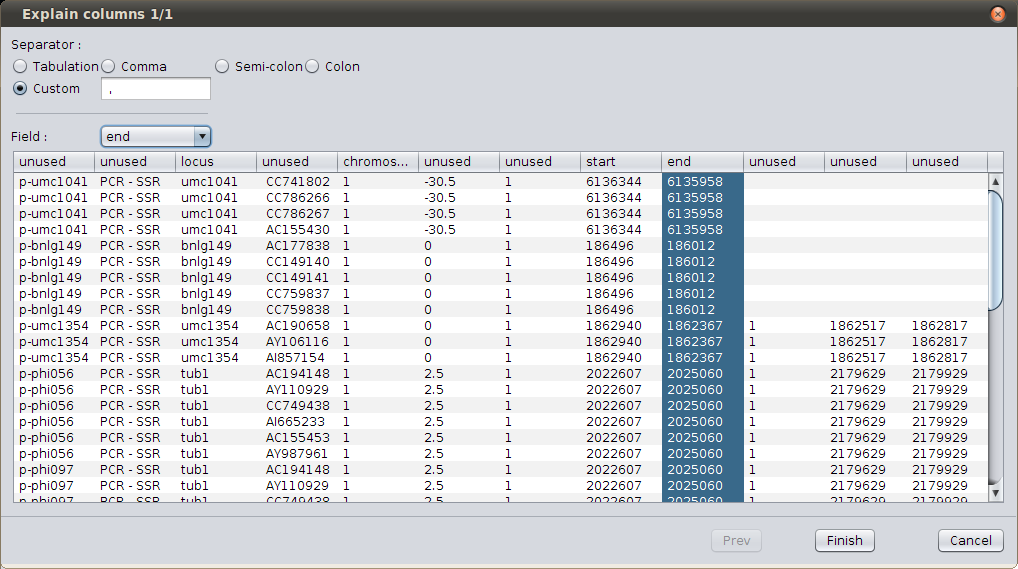
Change columns order
Carefully verify that the columns are the same, and then click on ‘Finish’ At last, click on browse for the database links and choose the ‘dblinks.txt’ file. Choose tabulation as separator, and then click on ‘Finish’.
You should wait for the files to be loaded until you get the following dialog; then, just click ‘Finish’ to save the genome version.
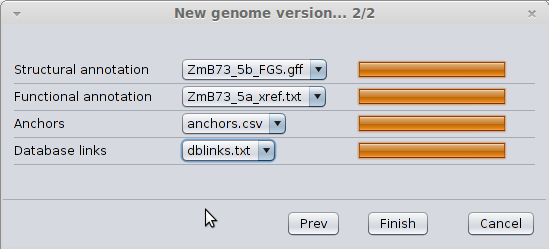
Progress state of file loading
Display a new genome version
We’re now going to display the new genome version; in the tab ‘Genome Version’ select ‘maize_1’; a progress bar should appear; wait until it’s completely loaded. Drag the linkage group from the explorer: Consensus/consensus/1/1/meta_v1 and unselect the QTLs display under the QTL tab (for a clearer view). Drag the scroller on the genetic map, and you’ll see it move along the sequence (vertical line in the middle), as well as the genes under the selected area (on the right side). As the ratio between cM and bp isn’t always the same, look at the scroller’s size on the sequence as you move the other one on the genetic map. (you can also resize the scoller or move the other one). You can also move the mouse over a gene. A menu appears with links to URGI, gramene or maizeGDB databases. You can click on one of them, it will open a browser with the page corresponding to the selected gene.
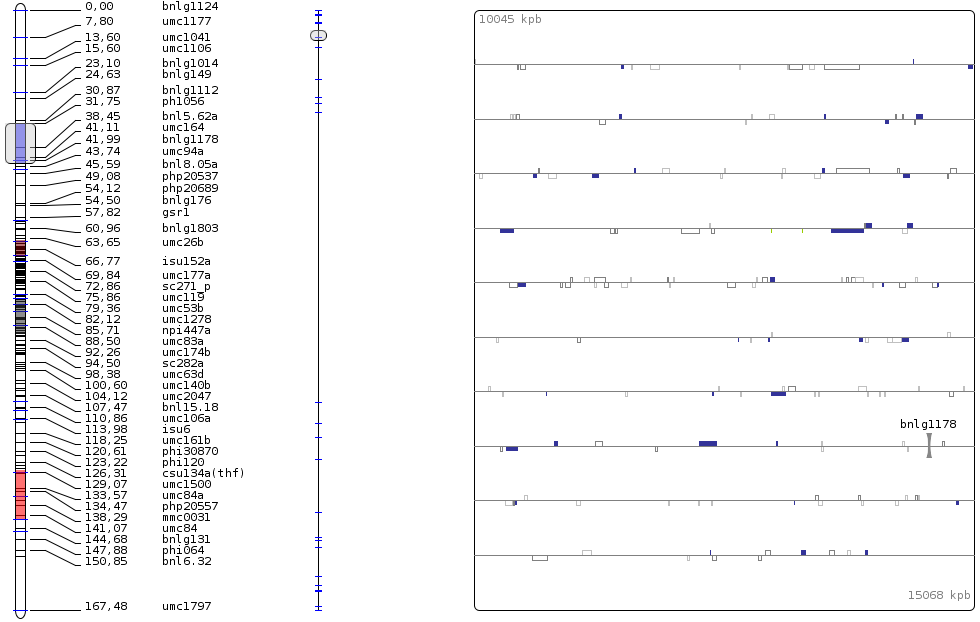
Display genome view
Click then on the first meta-QTL. The Cursor is positioned automatically around it. Now, in the ‘View’ menu, choose ‘Show the GO view’. A panel appears at the bottom. The colors shown in the chart represent the Gene Ontology terms, and are used for the genes color; clicking on a chart section will enlighten the corresponding genes, and clicking a second time (not a double-click) will make you go deeper in the GO hierarchy.
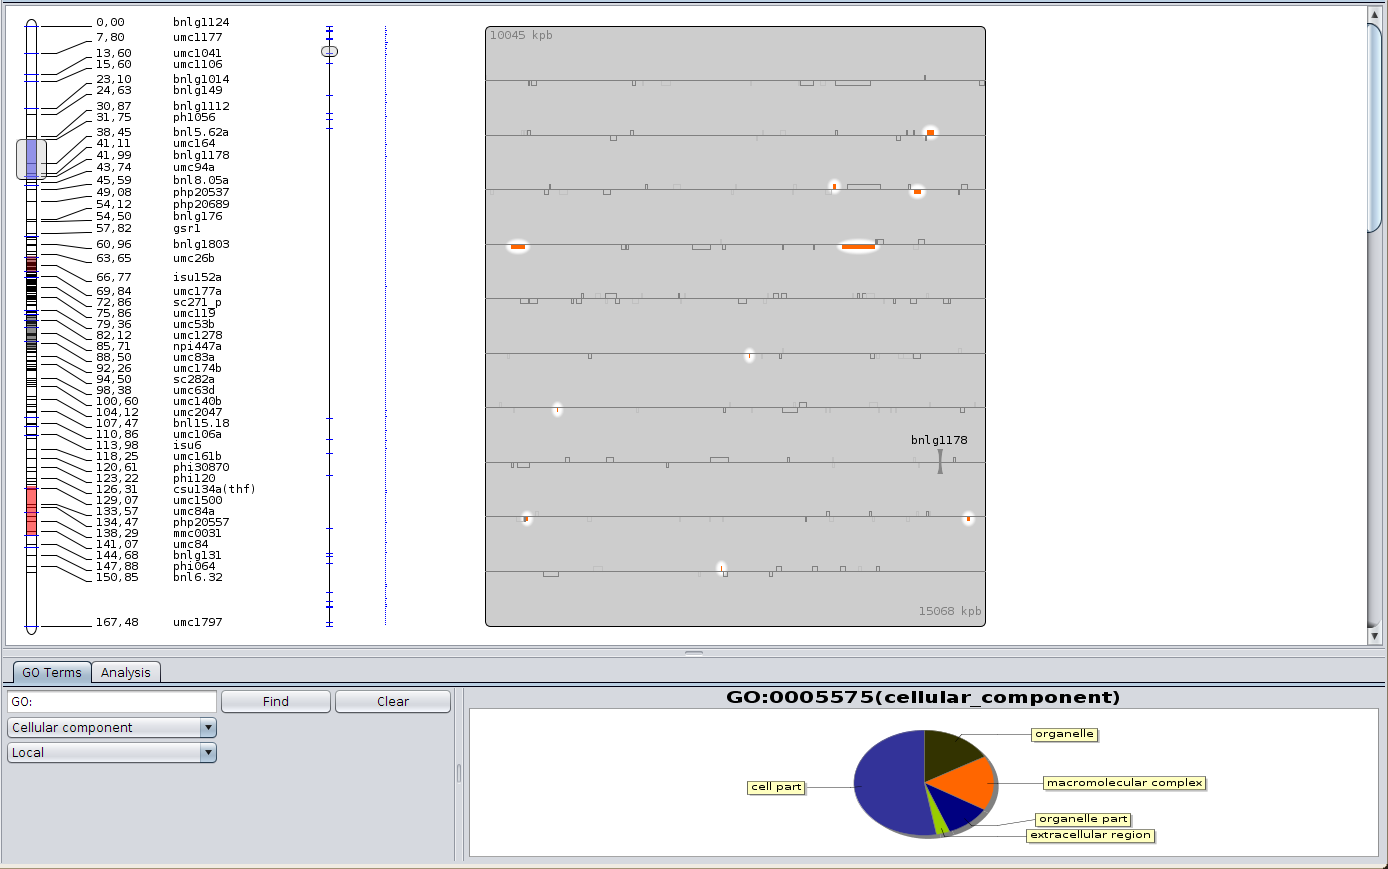
Display Gene Ontology piechart
Analyzing GO terms over-representation
Another tool in BioMercator is the GO representation analysis; select the Analysis tab in the new panel, check the scroller is situated around the first metaQTL (click on the metaQTL if not) and just launch the analysis. The analysis gives you a list of GO terms over and under represented in the selected area (here, the meta-QTL) compared to the whole linkage group. The columns gives you more information about the term. Clicking on it will enlighten the genes with the corresponding annotation. Other analysis parameters are available, you could decide to analyze the representation along all intervals of a trait compared to the whole genome for instance.
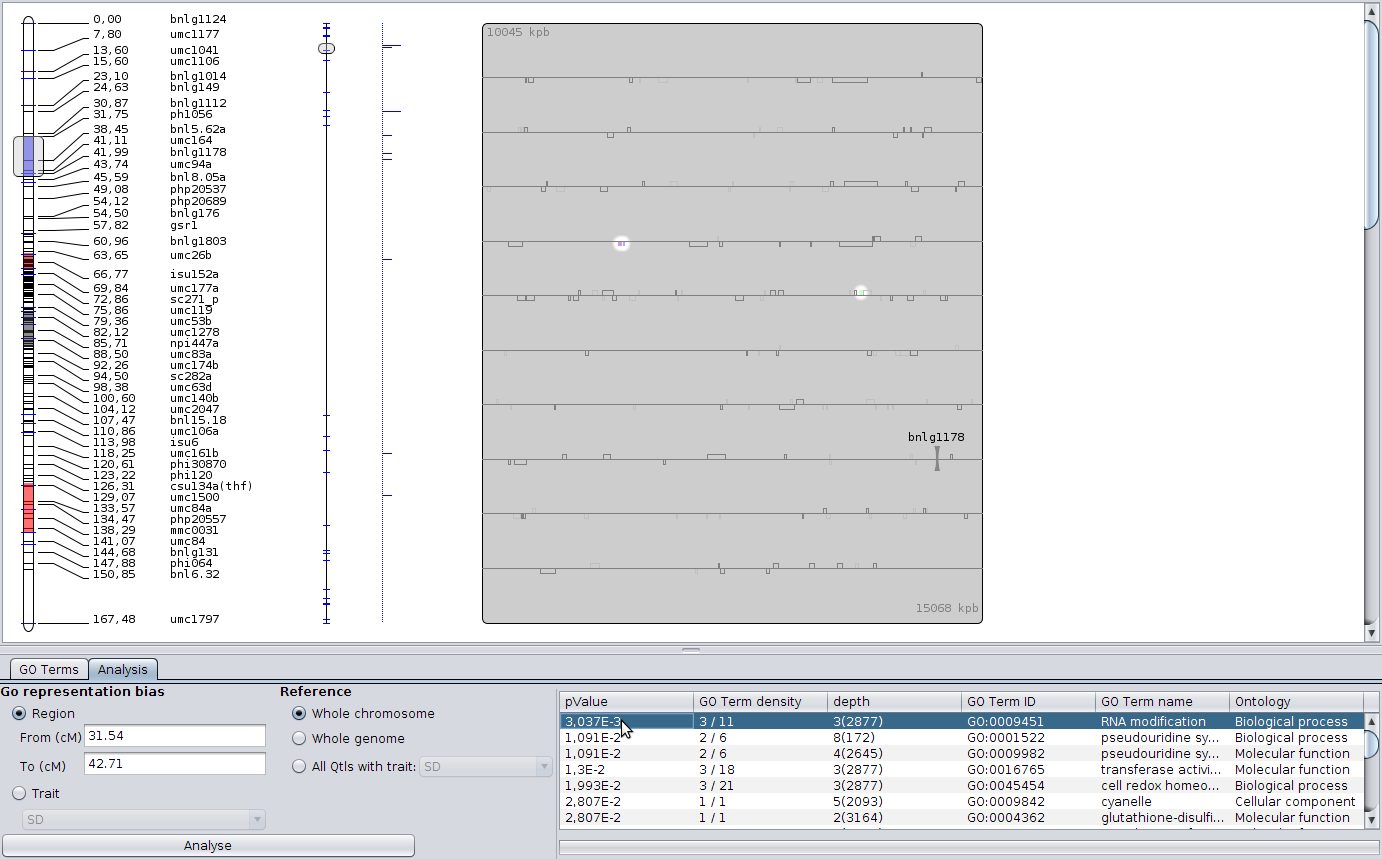
Emphasis annotated genes
Finally you can export genes into GFF3 file; Right click on the genes window, and select ‘Export to GFF’.
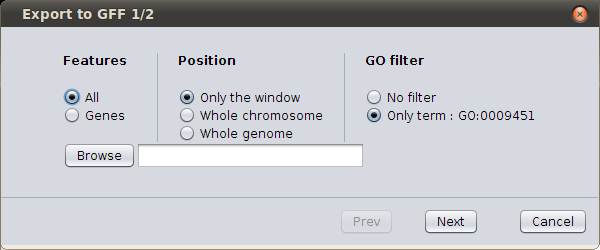
GFF export form
You can export all features or only genes. You can choose the window of export (just the scroller’s area, the whole chromosome or the whole genome). And you can choose to export only genes with the corresponding GO functional annotation. Browse to select the path of your new file, and click next. You’ll see in the created GFF the genes with all the structural annotation, but with also the GO annotation. The QTLs and meta-QTLs will be present in the GFF file.